

 Remember - the Library will be closed on Monday, September 5, 2016 for Labor Day.
To help our patrons celebrate - and remember what this holiday is all about - we've put together a book display in the Social Sciences room at Central Library that we will (most likely) keep up for most of September. Come take a look at it, and maybe check out a book or two to enjoy at home. We also have some great reference books on the subject, 2 of which are pictured here.
As a rule, the books on labor and unions are at Dewey 331.8(ish) - so in the beautiful wooden shelves under the windows looking east toward Christ Church Cathedral for circulating books, and in the beautiful wooden shelves on the interior west wall for the reference books.
In addition to the great resources at the Library, we recommend that you explore the St. Louis Federal Reserve Bank's FRASER digital archives, a rich source of primary source material on all things economic, including labor matters. Click here for a recent explanatory post about the Bureau of Labor Statistics unemployment numbers.
Finally (before we let you go enjoy your Labor Day BBQ), here is some information on Labor Day and U.S. employment related numbers from the U.S. Census Bureau.
The first observance of Labor Day was likely on Sept. 5, 1882,
when some 10,000 workers assembled in New York City for a parade. The parade
inspired similar events across the country, and by 1894 more than half the
states were observing a “workingmen’s holiday” on one day or another. Later
that year, with Congress passing legislation and President Grover Cleveland
signing the bill on June 29, the first Monday in September was designated
“Labor Day.” This national holiday is a creation of the labor movement in the
late 19th century and pays tribute to the social and economic achievements of
American workers.
Who Are We Celebrating?
158.5 millionThe number of people age 16 and over in the nation’s labor force as of May 2016.
16.4 million
The number of wage and salary workers age 16 and over represented by a union in 2015. This group included both union members (14.8 million) and workers who reported no union affiliation but whose jobs were covered by a union contract (1.6 million). Among states, New York continued to have the highest union membership rate (24.7 percent), and South Carolina had the lowest rate (2.1 percent).
Source: U.S. Bureau of Labor Statistics
Table 5. Union affiliation of employed wage and salary workers by state
15.2 million
The number of employed female workers age 16 and over in service
occupations in 2014. Among male workers age 16 and over, 11.8 million were
employed in service-related occupations.

1.9%
The percentage increase in employment, or 141.9 million, in the
U.S. between December 2014 and December 2015. In December 2015, the 342 U.S.
counties with 75,000 or more jobs accounted for 72.5 percent of total U.S.
employment and 77.8 percent of total wages. These
342 counties had a net job growth of 2.2 million over the year,
which accounted for 81.4 percent of the overall U.S. employment increase.
Source: U.S. Bureau of Labor Statistics
Another Day, Another Dollar
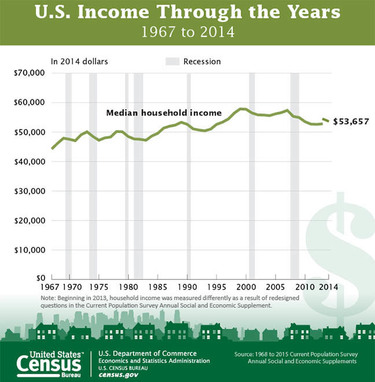
$50,383 and $39,621
The 2014 real median earnings for male and female full-time,
year-round workers, respectively. The 2014 real median household income of
$53,657 is not statistically different in real terms from the 2013 median of
$54,462.
The Commute to Work
6.3 million
The number of commuters who left for work between midnight and
4:59 a.m. in 2014. They represented 4.5 percent of all commuters. The most
common time was between 7 a.m. and 7:29 a.m. – with 20.6 million commuters.
76.5%
The percentage of workers age 16 and over who drove alone to
work in 2015. Another 9.2 percent carpooled and 0.6 percent biked to work.
26.0 minutes
The average time it took workers in the U.S. to commute to work
in 2014. New York (32.6 minutes) and Maryland (32.3 minutes) had the most
time-consuming commutes.

No comments:
Post a Comment